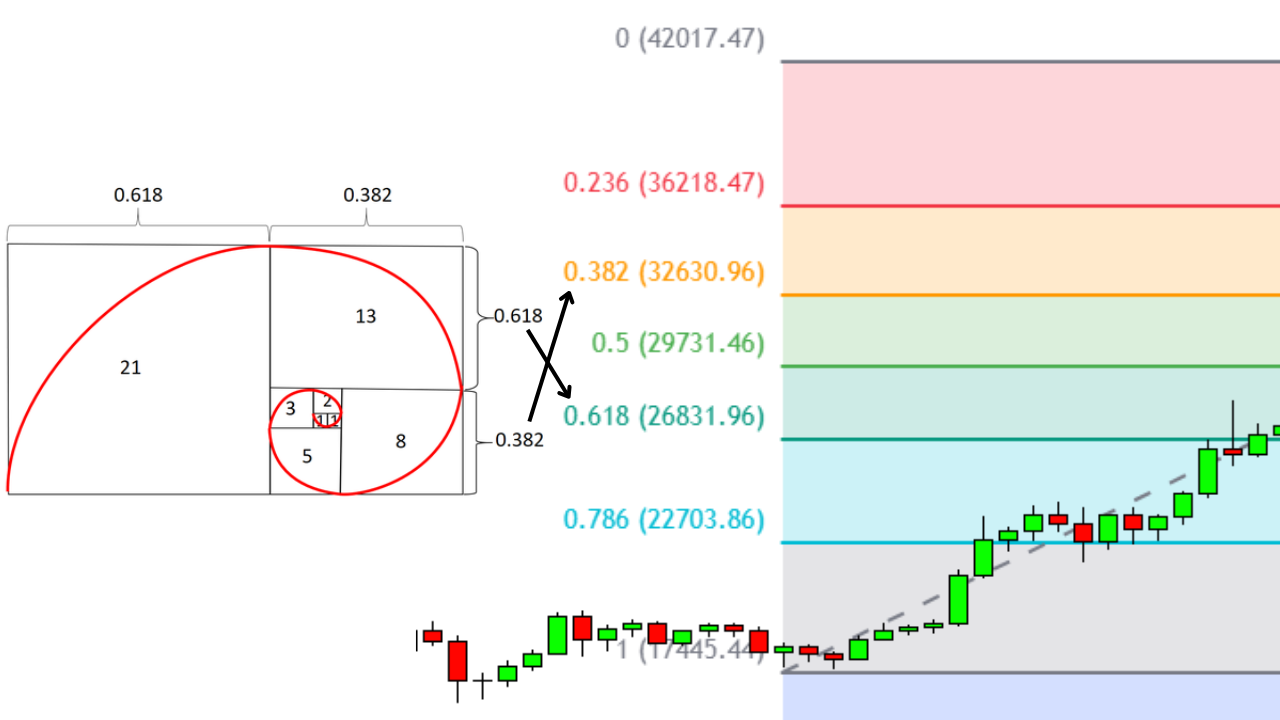
A Fibonacci retracement is a technical analysis tool traders use to identify potential levels of support and resistance within a price trend. It’s built on ratios derived from the Fibonacci sequence, a mathematical pattern that appears throughout nature and financial markets. The most commonly used levels are 23.6%, 38.2%, 50%, 61.8%, and 78.6%. These percentages represent how far a price may retrace before resuming its original direction.
The tool is widely introduced in online trading courses because it gives traders a structured way to anticipate where a pullback might slow down or reverse. Rather than guessing, Fibonacci retracement levels allow traders to anchor expectations around mathematically calculated zones on a chart.
While not a standalone signal, Fibonacci retracements can help map out potential entry and exit points. They are especially helpful for those looking to trade trends while keeping risk contained.
How Does the Fibonacci Tool Work on a Chart?
Using a Fibonacci retracement tool involves identifying two significant points on a stock chart: a recent high and a recent low. Once those two points are selected, the tool automatically draws horizontal lines at the key Fibonacci levels between them. These lines represent possible areas where the price might encounter resistance during an upward retracement or support during a downward retracement.
For example, if a stock rises from $100 to $150 and then begins to fall, a trader might expect potential support around the 38.2% or 61.8% retracement levels of that $50 move. These zones act as watchpoints for price behavior.
The key benefit of this method is that it adapts to different timeframes and asset types. When analyzing short-term charts or long-term trends, the tool applies the same logic. It helps traders stay focused on price structure rather than emotional decision-making.
Interpreting Price Movement Around Fibonacci Levels
Once Fibonacci levels are plotted, traders look at how the price behaves around them. If a stock pulls back and bounces cleanly off a level (such as the 61.8% retracement), it may signal strength and a potential continuation of the trend. On the other hand, if the price breaks through a level without hesitation, it could indicate weakening momentum or a possible reversal.
It’s important to watch how volume behaves during these moments. An increase in volume at a Fibonacci level may confirm its relevance, while low volume might signal indecision. Consolidation near a level can also provide useful information, especially when combined with other indicators.
These levels provide a framework for observing behavior and planning the next steps. Context, price structure, and confirmation from other data points all contribute to making informed trading decisions.
Popular Trading Setups Using Fibonacci Retracements
Many traders use Fibonacci retracements to guide decisions during trending markets. A common setup involves waiting for a pullback to a key retracement level, then entering a trade in the direction of the original trend if a price shows signs of continuation. This approach helps avoid chasing highs and supports disciplined entries.
Others may use Fibonacci levels to set stop-loss or take-profit points. For instance, a trader might place a stop slightly below a retracement level that has previously acted as support. Likewise, they might target a price move back toward the original trend high after a bounce from the 50% or 61.8% line.
Because retracements reflect areas where other traders are likely watching, they often serve as self-fulfilling levels in active markets. Still, experienced traders know to use these zones in conjunction with patterns, trends, and volume analysis to build more reliable setups.
Limitations and Misunderstandings
Fibonacci retracements are helpful, but they’re not without limitations. One common misunderstanding is assuming that price will always reverse at a retracement level. In reality, these lines represent zones of interest, not fixed turning points. Market behavior often depends on broader context, including trend strength, news events, or overall sentiment.
Another limitation is that retracement levels can be subjective. Different traders may choose different high and low points when drawing the tool, which can result in varying interpretations. For this reason, Fibonacci levels should be viewed as part of a bigger picture rather than as standalone signals.
Using this tool effectively requires discipline and confirmation. Relying on Fibonacci levels alone can lead to overconfidence or missed signals. Combining them with other indicators, such as trend lines or volume, helps reduce the risk of reacting to noise.
Bringing Structure to Your Chart Analysis
Fibonacci retracements give traders a way to spot key levels during a market pullback or rally. The tool helps outline structure, especially during trending conditions. While not predictive on its own, it offers a valuable perspective when used alongside other indicators and solid trade planning.